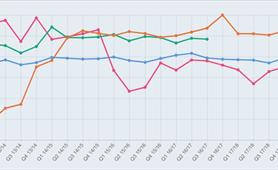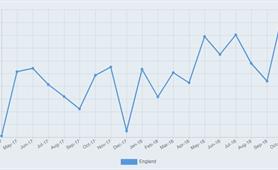
Number of people subject to the Mental Health Act 1983
This chart shows the number of people subject to the Mental Health Act 1983 (England and Wales) at the end of each month. The figures can be examined from a national perspective or at provider level. You can also compare data with up to three other providers as appropriate.
Policy context
These figures are relevant to the aspiration to reduce the number of people subject to the Mental Health Act, as detailed in the 2018 Independent Review of the Mental Health Act 1983.
Notes: This data has not been adjusted to take account of different population sizes, so comparison between areas should be interpreted with caution. NHS Digital have also classified this data as 'experimental' so should therefore be used with some caution.
Not what you are after?
Take a look at these related indicators or view future indicators.