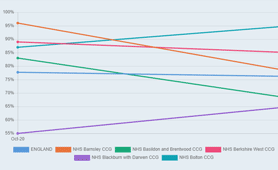
Proportion of people in effective treatment for substance misuse
This chart shows the percentage of adults in receipt of specialist drug and alcohol services in a community setting deemed to be in ‘effective treatment’. The percentages are based on the combined numbers for those in treatment for opiate, non-opiate only and non-opiate & alcohol addictions. The figures can be examined from a national perspective, local government region or local authority level. You can also compare data with up to five other areas.
Exploring the charts: To explore local government regions or local authority performance, click on the tab and then click in the box to select different areas. We should expect the lines to trend upwards over time.
Policy context
Individuals are defined as being in ‘effective treatment’ who are recorded as having commenced treatment within the period covered and who meet either of the following criteria: retained for 12 weeks or more from their triaged date; or successfully exited from treatment. The data is published at a three-month remove from the other treatment data by the National Drug Treatment Monitoring System (NDTMS) to ensure that all eligible individuals are followed-up for the full twelve week period.